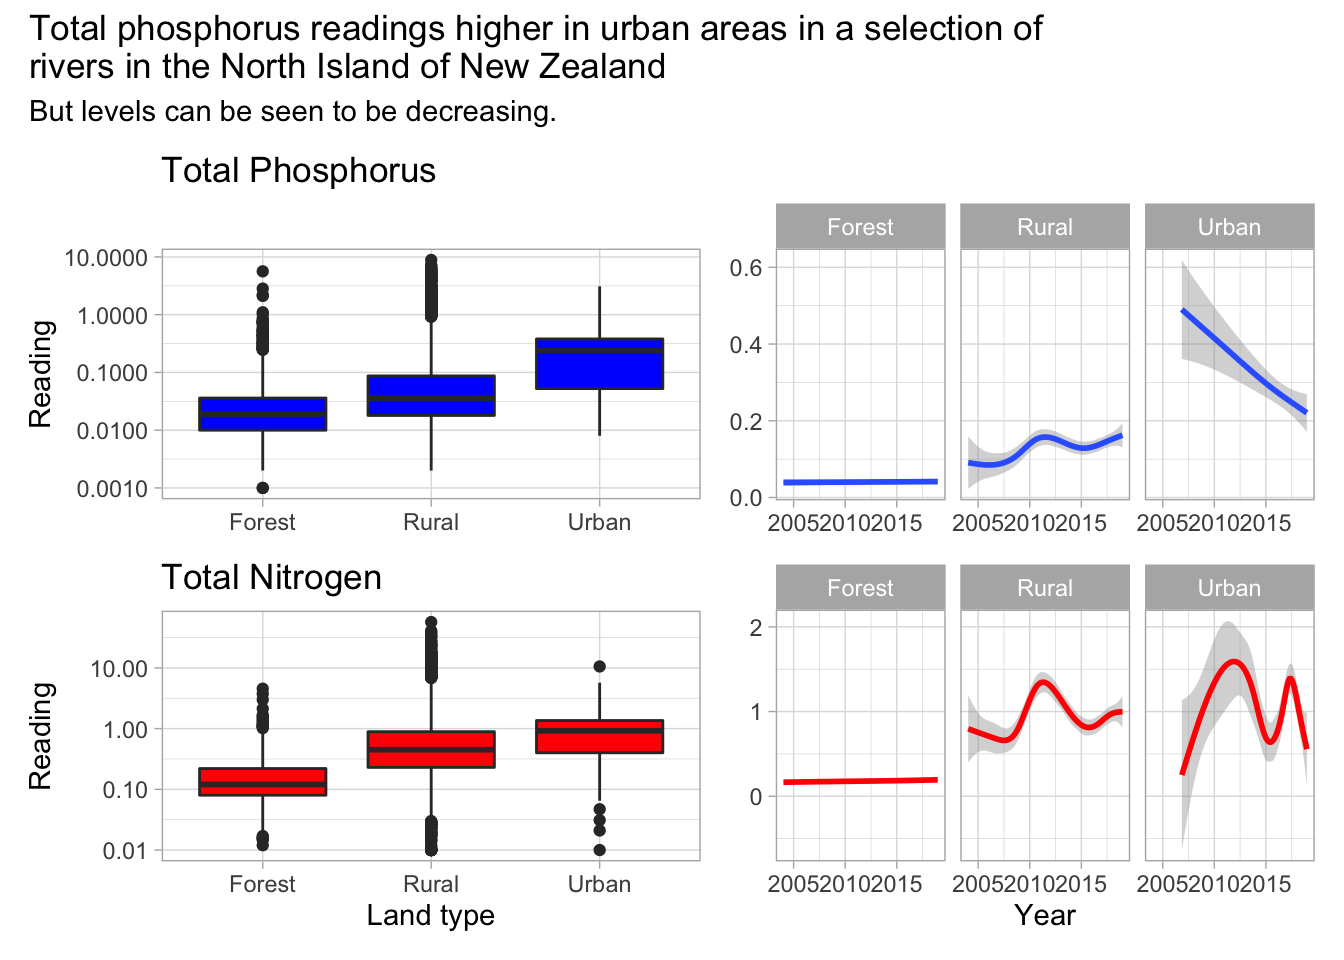
I chose to focus on two measures, total nitrogen and total phosphorus and compare these across the three land types, rural, urban and forest. I chose to use a box plot to compare the values for the total nitrgoen and total phosphorus for the three land types as this gave a good visual comparison across the groups. I used geom_smooth to show if there was a trend in the readings over time at the different areas. I chose to smooth the data as without this, it was very busy and a trend could not be easily visualised. The graphs show that the median readings for both total nitrogen and total phosphorus are higher in urban sites then forest and rural but more so for total phosphorus. However, it can also be seen that for total phosphorus, levels are decreasing at urban sites where as for total nitrogen they seem to be fluctuating throughout the years. The levels of both measurement for forest land are the lowest of the three and appear to be remaining steady neither increasing or decreasing.
library(tidyverse)
library(patchwork)

lawa <- read_csv("http://www.massey.ac.nz/~jcmarsha/161122/LAWA/lawa32.csv")

lawa_tp <- lawa %>%
  group_by(SiteID,SWQLanduse,Date) %>%
  filter(!is.na(TP))

lawa_tn <- lawa %>%
  group_by(SiteID,SWQLanduse,Date) %>%
  filter(!is.na(TN))

g2 = ggplot(lawa_tn)+
  geom_boxplot(mapping = aes(x= SWQLanduse, y= TN),fill="red")+
  scale_y_log10()+
  labs(title= "Total Nitrogen", y= "Reading", x= "Land type")

g1 = ggplot(lawa_tp)+
  geom_boxplot(mapping = aes(x= SWQLanduse, y= TP),fill="blue")+
  scale_y_log10(labels = scales::label_comma())+
    labs(title= "Total Phosphorus", y= "Reading", x= NULL)

g4 = ggplot(lawa_tn)+
  geom_smooth(mapping = aes(x= Date, y= TN),col= "red")+
  facet_wrap(vars(SWQLanduse))+
  labs(x= "Year", y= NULL)

g3 = ggplot(lawa_tp)+
  geom_smooth(mapping = aes(x=Date, y= TP))+
  facet_wrap(vars(SWQLanduse))+
  labs(x= NULL, y= NULL)

(g1 / g2 | g3 / g4) +
  plot_annotation(title = "Total phosphorus readings higher in urban areas in a selection of
rivers in the North Island of New Zealand",
subtitle = "But levels can be seen to be decreasing.") &
 theme_light()