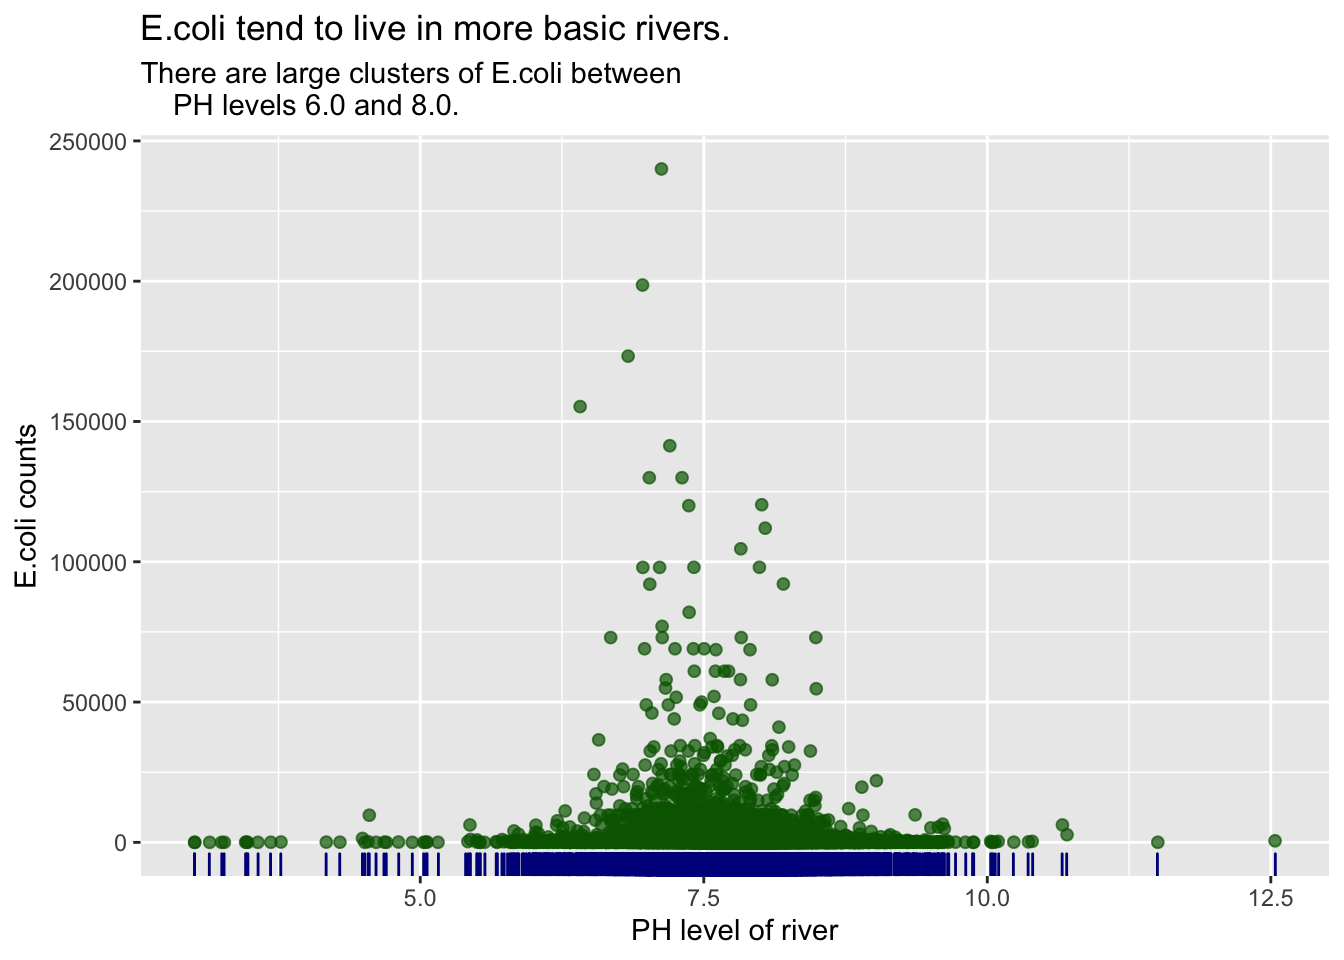
I chose to compare PH levels of rivers with E.coli count to show river quality. I chose to find if there was a correlation between them, to find the preferred environment of the E.coli.I decided that I wouldn’t use the data of PH below 3 because it didn’t show much and made the data extremely left skewed and I was unable to see the smaller details in the clustered data. I decided to use geom_point because I liked being able to see the extreme counts of e.coli and PH levels. I choose to use alpha = 0.7 as I am able to see the extreme values and tell where the large cluster starts to defuse. I chose to use a rug to show how clustered the slight left skew was, as well as getting more indication on when the edges of the cluster started to thin out. The graph shows that larger populations of e.coli live in waters with a PH level between 6 and 8, not only does the higher numbers of e.coli live in these water levels but most of the cluster falls within these levels. Outside of the main cluster is very few e.coli, which shows that they likely can’t live outside of the cluster PH.
library(tidyverse)

lawa <- read_csv("http://www.massey.ac.nz/~jcmarsha/161122/LAWA/lawa42.csv")

lawa%>%
  select(PH, ECOLI)%>%
  filter(PH>3)%>%
  ggplot() +
  geom_jitter(mapping=aes( x=PH ,y=ECOLI),
              size= 1.75, col="DarkGreen", alpha= 0.7) +
   geom_rug(mapping=aes(x=PH),col='DarkBlue') +
  labs(
    title = "E.coli tend to live in more basic rivers.",
    x= "PH level of river", y= "E.coli counts",
    subtitle = "There are large clusters of E.coli between
    PH levels 6.0 and 8.0.")