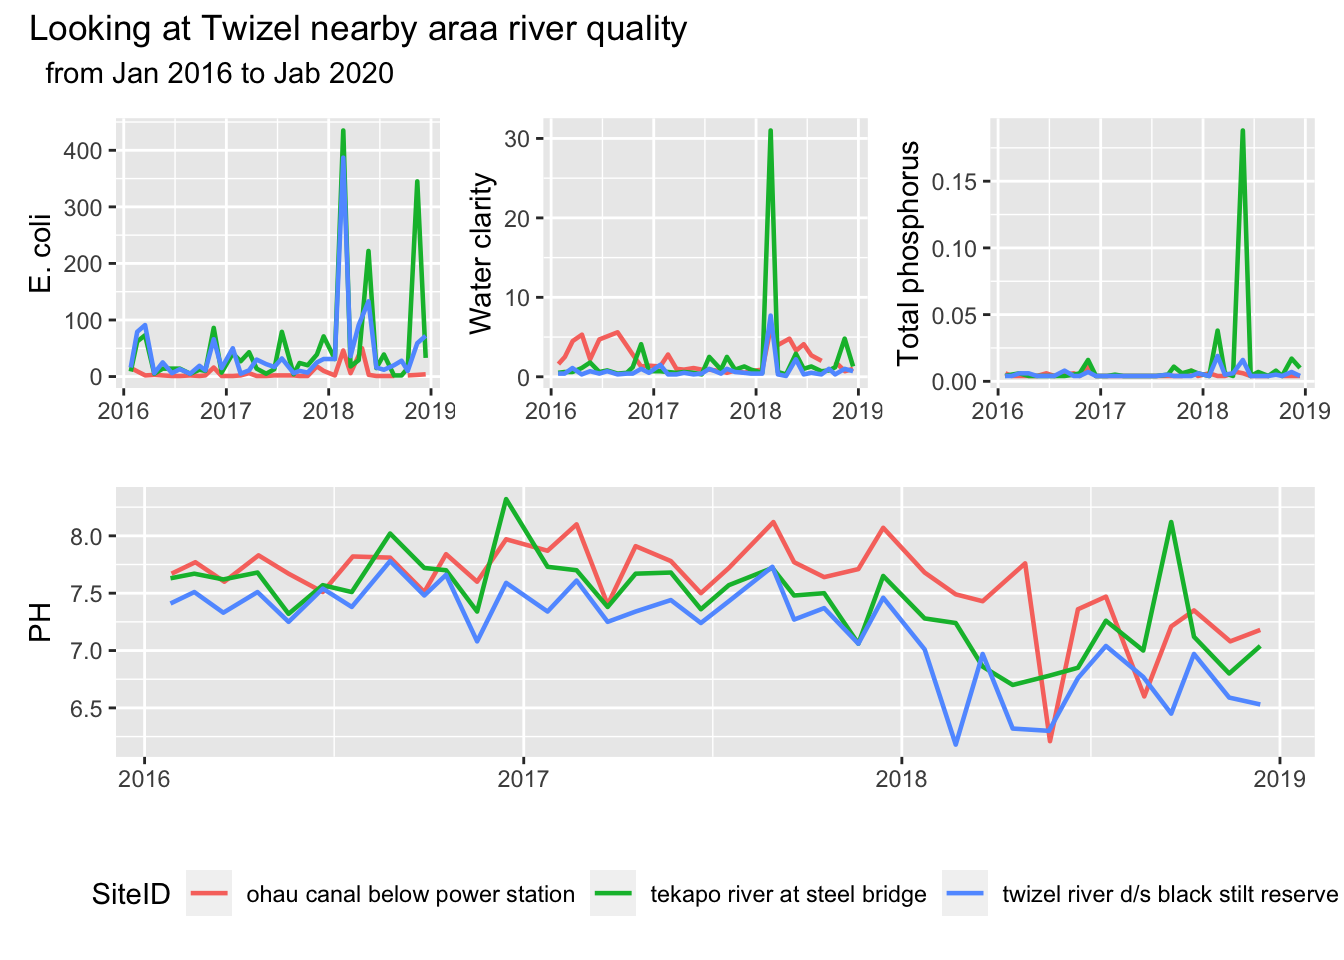
I chose to do a case study on Twizel and nearby surround aeras rivers water quality . The period of the study is from January 2016 to January 2019. Tracking the changes in E. coli, Water clarity, Total phosphorus and PH over the time period. This shows how the water quailty changes over time in the rivers in Twizel area.
library(tidyverse)
library(lubridate)
library(patchwork)
lawa <- read_csv("http://www.massey.ac.nz/~jcmarsha/161122/LAWA/lawa92.csv")

twizel_area_lawa <- lawa %>%
  filter(Lat < -44, Lat > - 44.6, Long > 170.1, Long < 170.3) %>%
  filter(Date >= as.Date("2016-01-01"))

g_ecoli = ggplot(twizel_area_lawa) +
  geom_line(aes(x = Date, y = ECOLI, colour = SiteID), size = 0.8) + labs(x="", y="E. coli")

g_turb = ggplot(twizel_area_lawa) +
  geom_line(aes(x = Date, y = TURB, colour = SiteID), size = 0.8 ) + labs(y="Water clarity", x = "")

g_total_phosphorus = ggplot(twizel_area_lawa) +
  geom_line(aes(x = Date, y = TP, colour = SiteID), size = 0.8 ) + labs(y="Total phosphorus", x ="")

g_ph = ggplot(twizel_area_lawa) +
  geom_line(aes(x = Date, y = PH, colour = SiteID), size = 0.8 ) + labs(x="")

(((g_ecoli | g_turb ) | (g_total_phosphorus)) / g_ph) + plot_annotation(title = "Looking at Twizel nearby araa river quality", subtitle = "  from Jan 2016 to Jab 2020") + plot_layout(guides = "collect", widths = 10) & theme(legend.position='bottom')