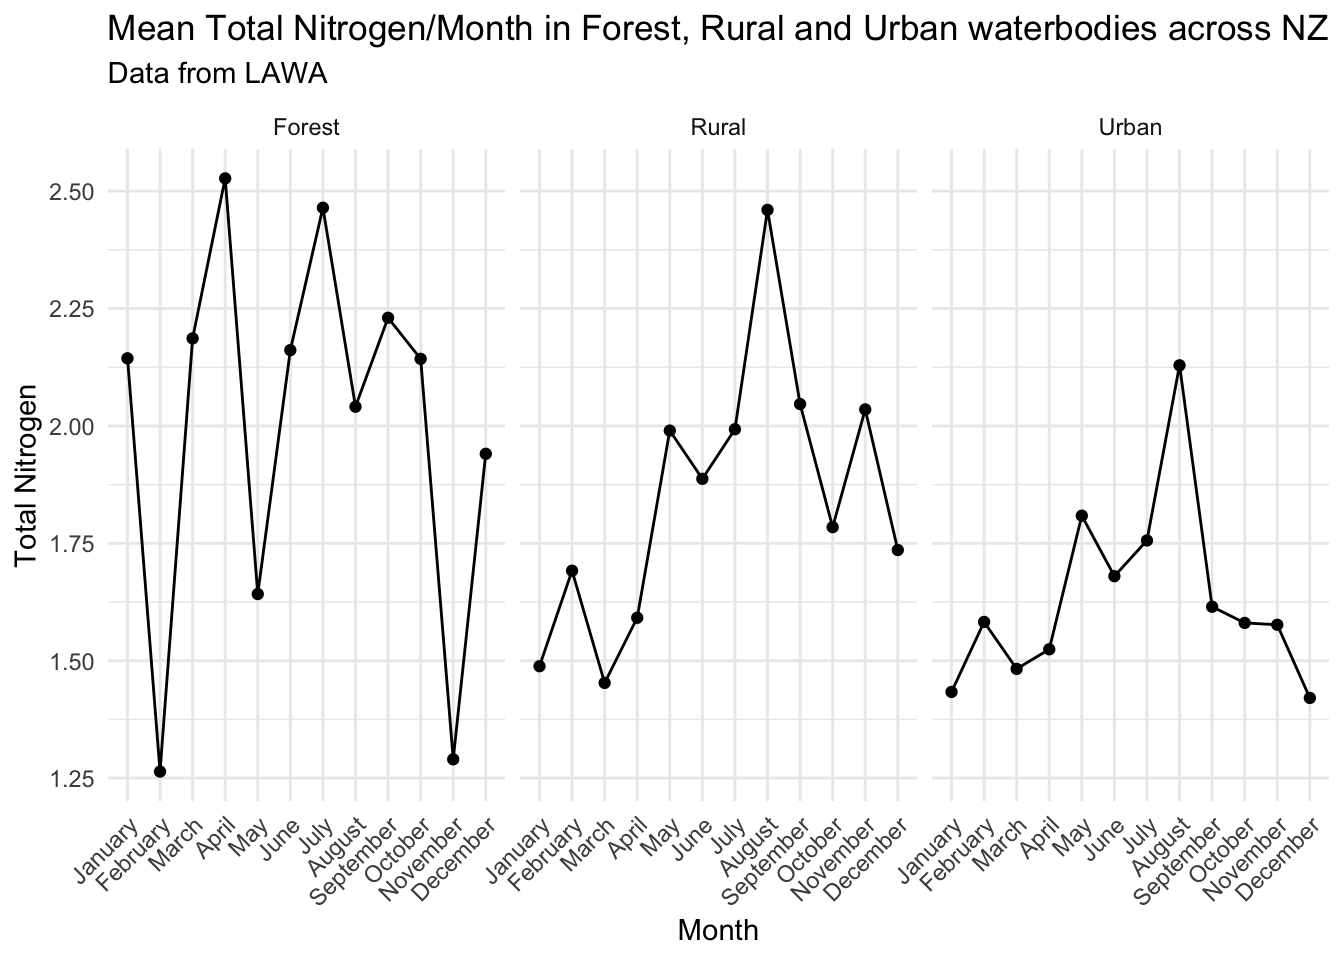
My graphs show the mean total nitrogen per month in rural, forest and urban waterbodies across New Zealand. I chose to do my story on the total mean nitrogen in waterbodies per month because, especially in New Zealand due to our large milk industry we have a large amount of nitrogen leaching and runoff, the quality of our rivers, creeks and streams is important to monitor for both our countries health as well as the the heath of New Zealanders who may drink from or swim in those waters. Comparing the total nitrogern/month allows us to see that across all three areas, Forest, Rural and Urban, Total nitrogen tends to be higher in the winter months where assumably, more runoff is occuring due to more rain and reduced ins spring and summer months when runoff is likely reduced as less rain. I chose to use line and point graphs as this allows you to easily see how the total nitrogen levels differ depending on the month.
library(tidyverse)
library(lubridate)

lawa <- read_csv("http://www.massey.ac.nz/~jcmarsha/161122/LAWA/lawa73.csv")

newdata = lawa %>% mutate(Date = month(Date, label=TRUE, abbr = FALSE)) %>% drop_na(TN) %>% group_by(SWQLanduse, Date, TN) %>% group_by(SWQLanduse,Date) %>% summarise(TN = mean(TN))

ggplot(data = newdata, aes(y=TN,x=Date, group=1)) +
  geom_point() +
  geom_line() +
  facet_wrap(vars(SWQLanduse)) +
  theme_minimal() +
  theme(axis.text.x = element_text(angle = 45, vjust = 1, hjust = 1)) +
  labs(x="Month", y="Total Nitrogen", title="Mean Total Nitrogen/Month in Forest, Rural and Urban waterbodies across NZ", subtitle="Data from LAWA")