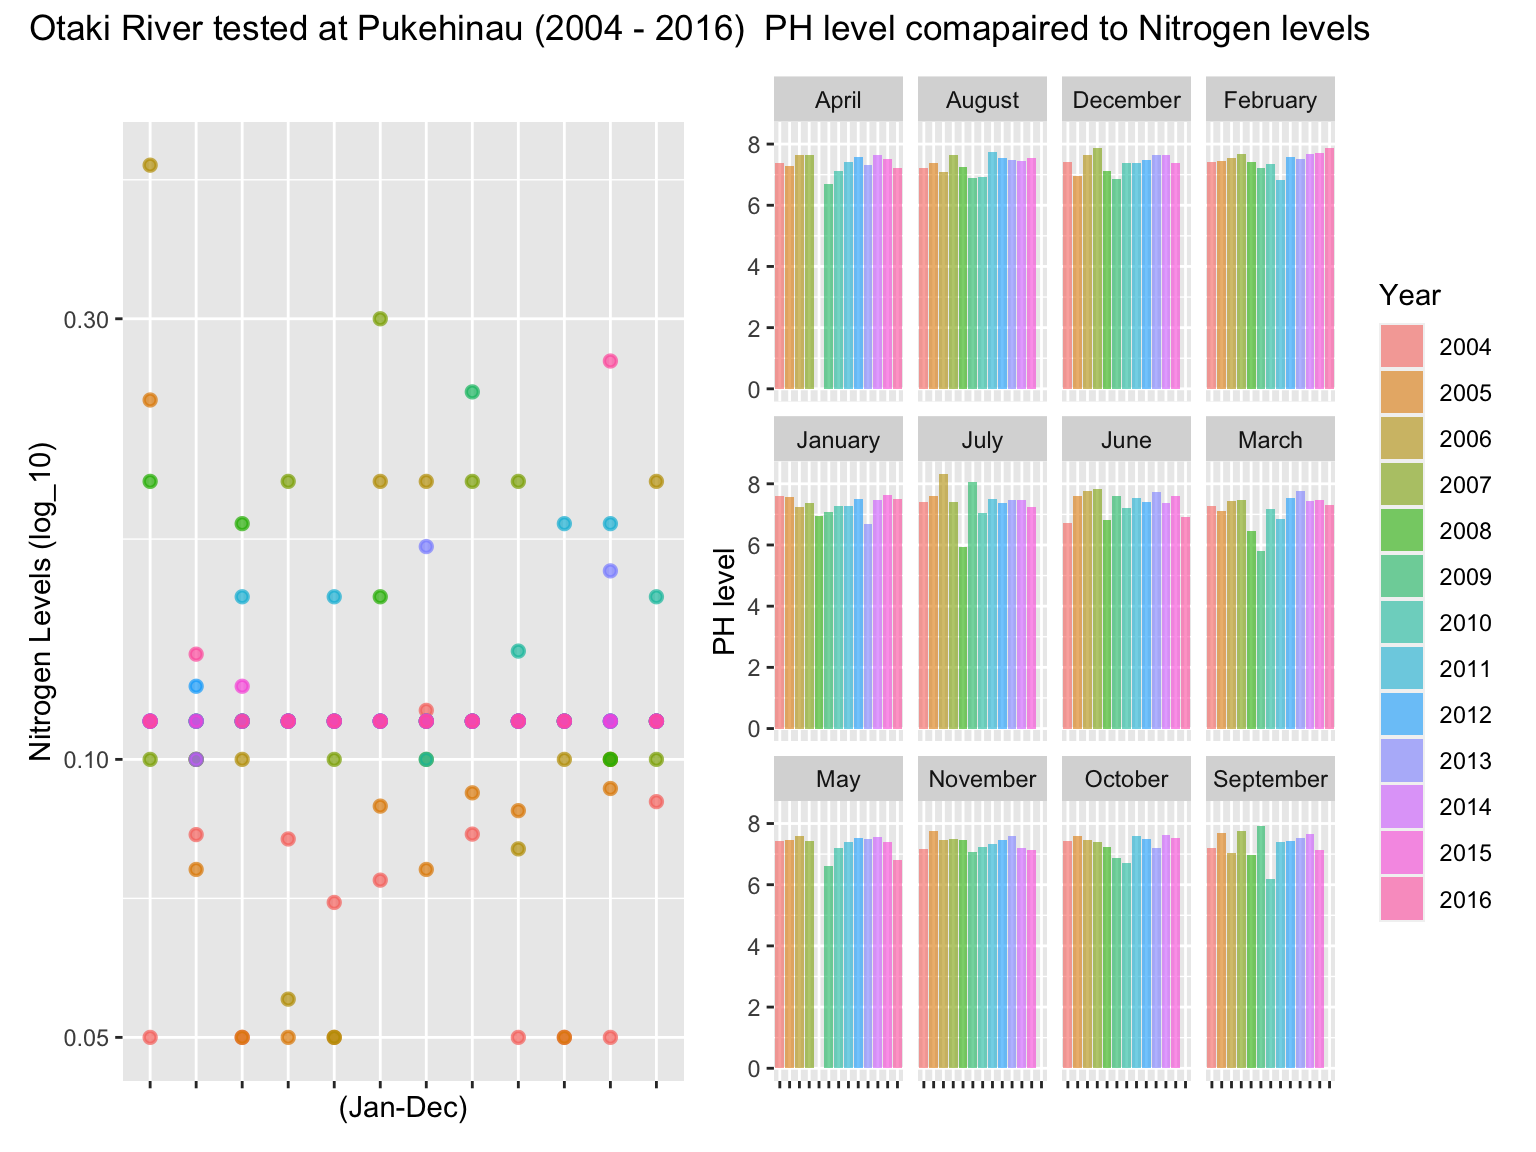
The story I was trying to portray was the relationship between Nitrogen levels effecting the PH levels in the water monthly to allow us to look for seasonality changes. I wanted to see if in winter, when less plantation is growing, does the nitrogen levels increase or decrease in the water and the effect this has on the PH of the water. My assumption was that during winter when there were less plants and algae on the river bed that less nitrogen would be present due to the lack of need as less plants are growing. The increase of nitrogen in water is highly toxic for aquatic animals so it was opening the question of seasonal quality of life in aquatic animals but alas this is not so from my findings.There are irregularities in the levels of nitrogen in the water, for example in April 2006 the nitrogen levels had a massive spike but the next recorded month drop drastically, we can assume this to be an external force effecting the readings.
I used a column graph for the PH because it allows for a quick reading in a comparison of a raise or drop of the levels from year to year. I also put this into multiple tables, so we can compare the months individually allowing us to compare the seasonal difference and if there was a gradual change in seasons as time progressed. As for the nitrogen I used a dot plot with the keys I used we can differentiate the individual values easy and compare them against the other values in this month and after, the year. In conclusion I believe there to be no correlation between the PH levels in water and the Nitrogen levels in water nor does the season bear an effect on the data.
library(tidyverse)
library(patchwork)

lawa <- read_csv("http://www.massey.ac.nz/~jcmarsha/161122/LAWA/lawa56.csv")

g1 = lawa %>%
  mutate(Year = substring(Date,1,4),
         Month = months(Date, abbr = FALSE)) %>%
  filter(SiteID == "otaki river at pukehinau", Year <= "2016") %>%
  select(PH, Year, Month) %>%
  ggplot()+
  geom_col(aes(x = Year, y = PH, fill=Year),
           alpha = 0.6, na.rm = TRUE, position = "Dodge")+
  facet_wrap(vars(Month), ncol=4)+
  theme(axis.text.x = element_blank())+
  labs(x = "", y ="PH level")

g2 = lawa %>%
  mutate(Year = substring(Date,1,4),
         Month = months(Date, abbr = FALSE)) %>%
  filter(SiteID == "otaki river at pukehinau", Year <= "2016") %>%
  select(TN, Year, Month) %>%
  ggplot(aes(x=Month,y=TN))+
  geom_point(aes(colour = Year),
             alpha = 0.7, stroke = .9, na.rm = TRUE)+
  theme(axis.text.x = element_blank(),
        legend.position = "none")+
  scale_y_log10()+
  labs(x="(Jan-Dec)",y ="Nitrogen Levels (log_10)")


g2 + g1 + plot_layout(guides = 'collect')+
  plot_annotation(title = "Otaki River tested at Pukehinau (2004 - 2016)  PH level comapaired to Nitrogen levels")